
This report is designed to show you the total number of points of distribution lost within a selected time frame.
**NOTE: Requires sales data
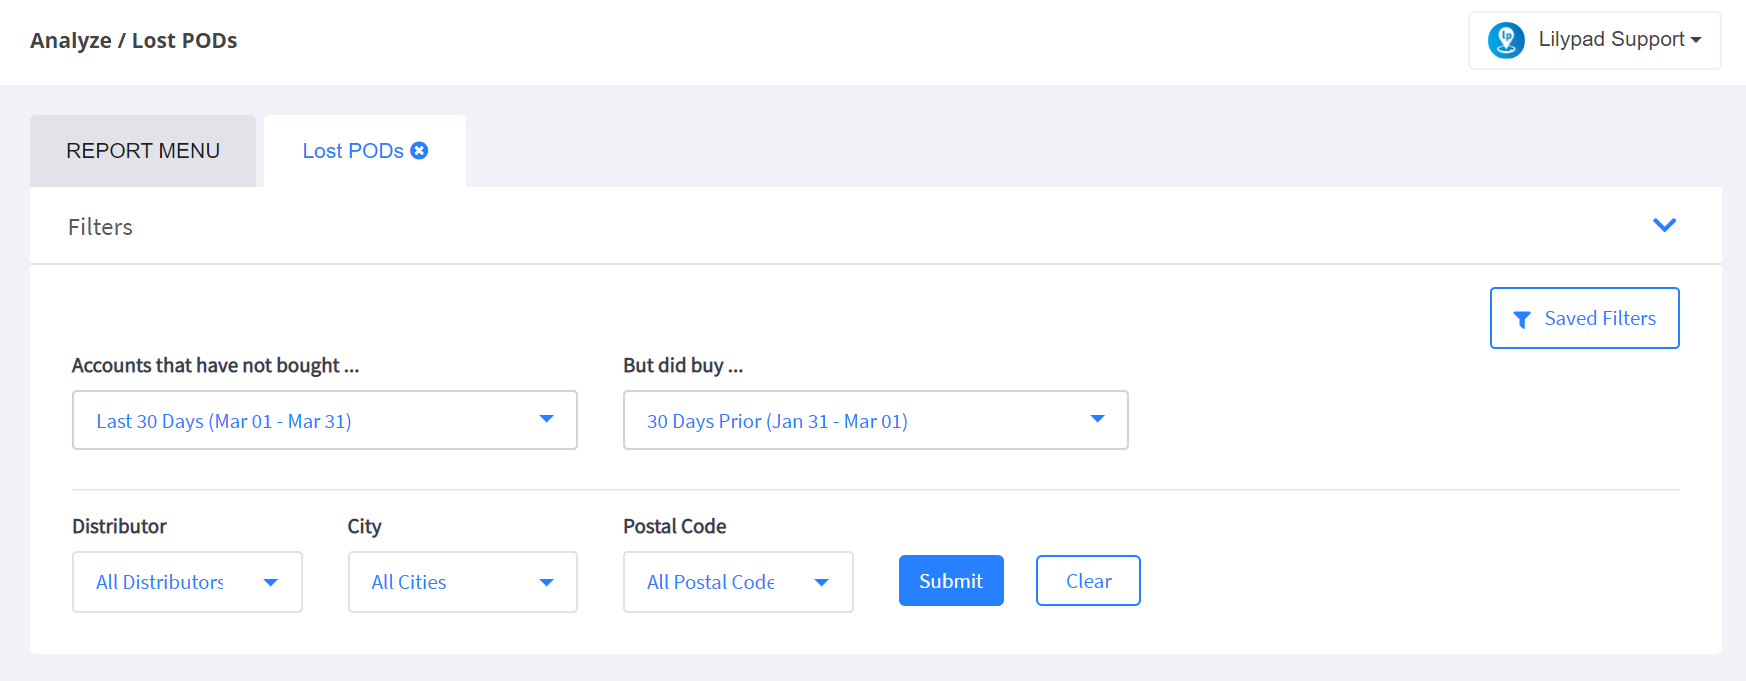
- Choose the time frame in which you’d like to see accounts who have not made a purchase but who had purchased in a specified number of days prior (i.e. an account that did not make a purchase between June 1st and June 15th but who had purchased product at some point within the 30 days prior to that)
- Choose the distributors whose territory you would like included in the report
- Choose the cities and postal codes in which you would like to view new PODs in
- Click the blue “Submit” button
- NOTE** If you’d like to save these parameters to pull this report more efficiently in the future you can do so by clicking the Saved Filters button in the top right corner of the Filters area. You’d then click on the “Create New From Current Filters” and add a bookmark name and click “Save.” You’ll then be able to automatically pull this report with these pre-set filters at anytime in the future.
- Lost in This Time Frame: total number of lost PODs reported for the filters selected. This will also show you a comparison of PODs lost in the same period during the prior year.
- Average SKUs per Account: this will show the average number of SKUs sold in to these new PODs during the selected buying time frame in comparison to the same period during the year prior.
- Total PODs: this will show the total number of PODs reported in the chosen time frame in comparison to the same period during the prior year.
- Lost PODs: On Premise vs Off Premise – shows the breakdown of PODs lost during the selected time period based on either the on premise (green) vs. off premise (yellow) account classification.
- Lost PODs: Independent vs Chain – shows the breakdown of PODs lost during the selected time period based on independent (blue) vs. chain (yellow) account classification.
- Lost PODs: On Premise – Independent/Chain: shows the breakdown of on premise PODs lost based on independent (green) vs. chain (yellow) account classification.
- Lost PODs: Off Premise – Independent/Chain: shows the breakdown of lost off premise PODs based on independent (blue) vs. chain (yellow) account classification.
- Lost PODs by Distributor: the x-axis in this table shows the 10 distributors who reported the highest number of lost PODs during the selected time frame, while the y-axis in this table shows benchmark POD numbers. If you hover over any graph in this table you’ll then see a total number of lost PODs reported for the selected distributor.
- Lost PODs by Location: this is an interactive heat map that shows where the majority of your lost PODs are located. You can click into any point on this heat map to focus in on lost PODs reported in specific areas.
- Lost POD List: this table will present the following information for each POD lost during your chosen time frame –
- Account: the name of each lost POD
- Address: the physical address of each account
- Distributor: the distributor responsible for handling the account
- Premise: whether the account is classified as on or off premise
- Indep/Chain: whether the account is classified as an independent or chain account
- Last SKU Purchased: the last SKU that was sold in to the account before it was considered a lost POD
- Last Sales Logged: the date on which the most recent invoice was reported