
Activity Count is useful to see trends in which Activities/Tasks are logged most frequently, what the logging trends look like, and how many accounts each active user has touched. You can download any of these graphs as .png, .jpg, or .csv files. There are four white boxes that can generate different types of information and those are broken down below:
-
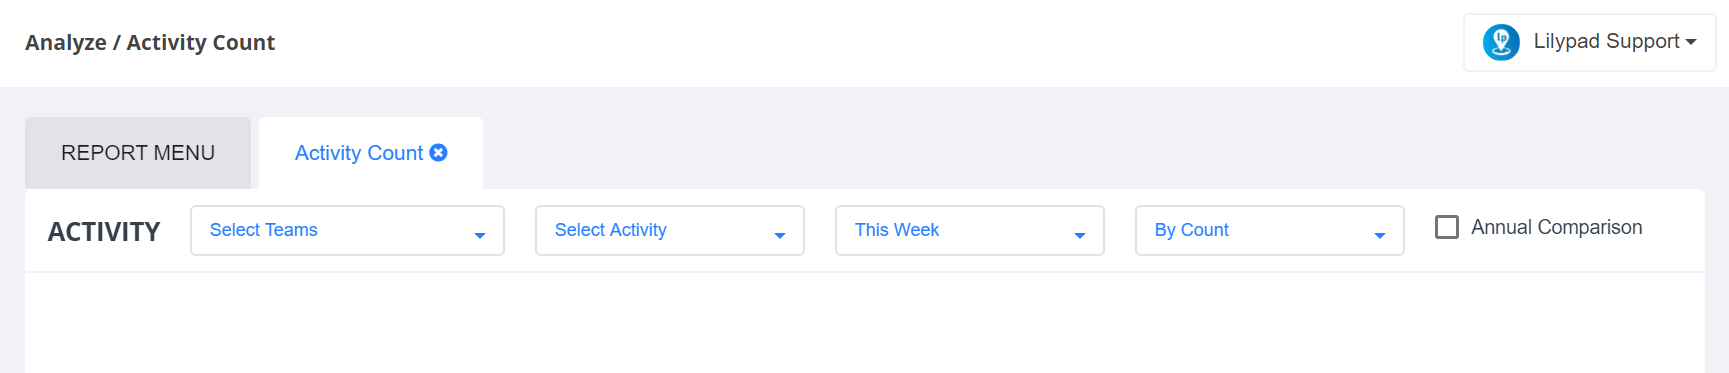
Box 1: “Activity”
- Choose the team(s) to include in this report.
- Choose the Activities/Tasks to include.
- Choose the date range.
- In the next drop down, choose to view the report 'By Count' (number of times selected Activities/Tasks are logged) or 'By Points' (total number of points earned by the Activities/Tasks logged).
- 'Annual Comparison' checkbox - check this box to see how these Activities/Tasks logs compare for the same period last year.
- As selections are made, the table will auto populate below the selections. Each Activity/Task will show as a separate bar on the graph. When hovering the cursor over each bar, the count or number of points (depending on what was chosen in the drop down at the top of the screen), will display what was logged for that particular Activity/Task.
- If 'Annual Comparison' was check marked, a clear indication of activities logged will show for last year (represented in dark gray) and for this year (represented in green).
-
Box 2: “Activity by User”
- Choose the team(s) to include in this report.
- Choose the rep(s) to include.
- Choose the Activities/Tasks to include.
- Choose the date range.
- In the next drop down, choose to view the report 'By Count' (number of times selected Activities/Tasks are logged) or 'By Points' (total number of points earned by the Activities/Tasks logged).
- As selections are made, the table will auto populate below the selections. Each Activity/Task will show as a separate bar on the graph. When hovering the cursor over each bar, the count or number of points (depending on what was chosen in the drop down at the top of the screen), will display what was logged for that particular Activity/Task.
-
Box 3: “Activity Trends”
- Choose the team(s) to include in this report.
- Choose the Activities/Tasks to include.
- Choose the date range - only daily, weekly or monthly is available.
- 'Annual Comparison' checkbox - checking this box will populate additional information to see how these Activities/Tasks logs compare for the same period last year.
- A table will populate below the drop downs as choices are made. In the line graph, the x-axis shows the number of times the Activity/Task was logged and the y-axis shows the date range (day, week, or month) in which that Activity/Task was logged. Hover over any of the points on the map to see a breakdown of each individual Activity/Task logged during the chosen time frame.
- Below the graph, is a legend showing the color associated with each Activity/Task.
-
Box 4: Accounts Touched
- Choose the team(s) to include in this report.
- Choose the rep(s) to include.
- Choose the Activities/Tasks to include.
- Choose the date range.
- A table will populate below the drop downs as choices are made. Each bar in the graph will show an active user for that time period. Hover over a specific bar to see the total number of accounts that user touched when logging the selected Activities/Tasks for the chosen time frame.