
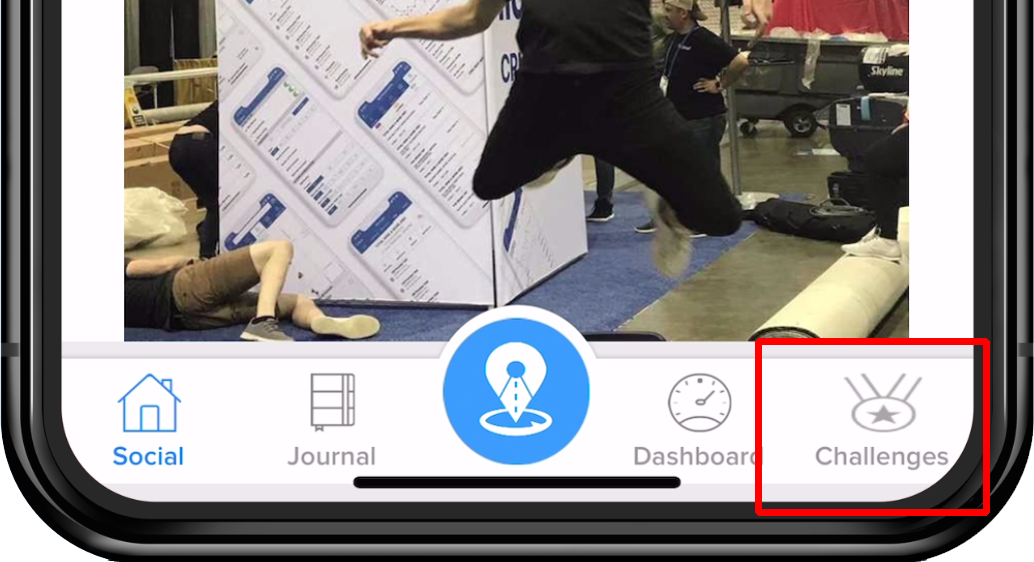
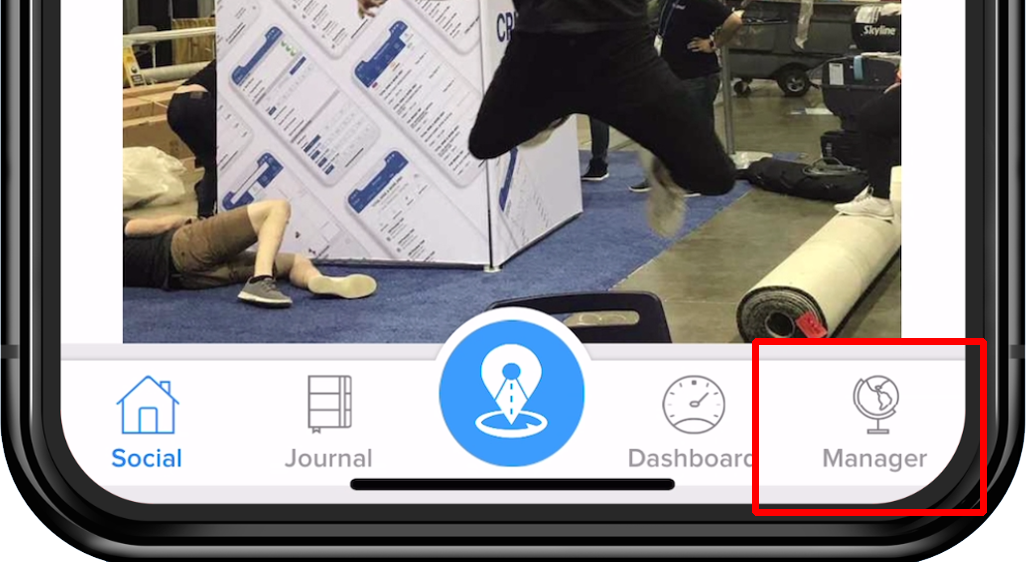
This button changes depending on the user's level of access as well as whether an organization has any sales being reported in (AKA Data Connections).
Typical users that are utilizing Lilypad as a CRM only, will see 'Challenges'. Those same types of users will see 'Sales' if data is being reported. Any Admin with Manager access, will see it as 'Manager'. Please see the documentation below for a more in-depth review of what these do for teams.
Challenges Menu
This is the view for reps who do not have Admin access and no sales are being reported into Lilypad. The Challenges icon will be viewed at the lower right and when clicked, the Leaderboards will be shown.
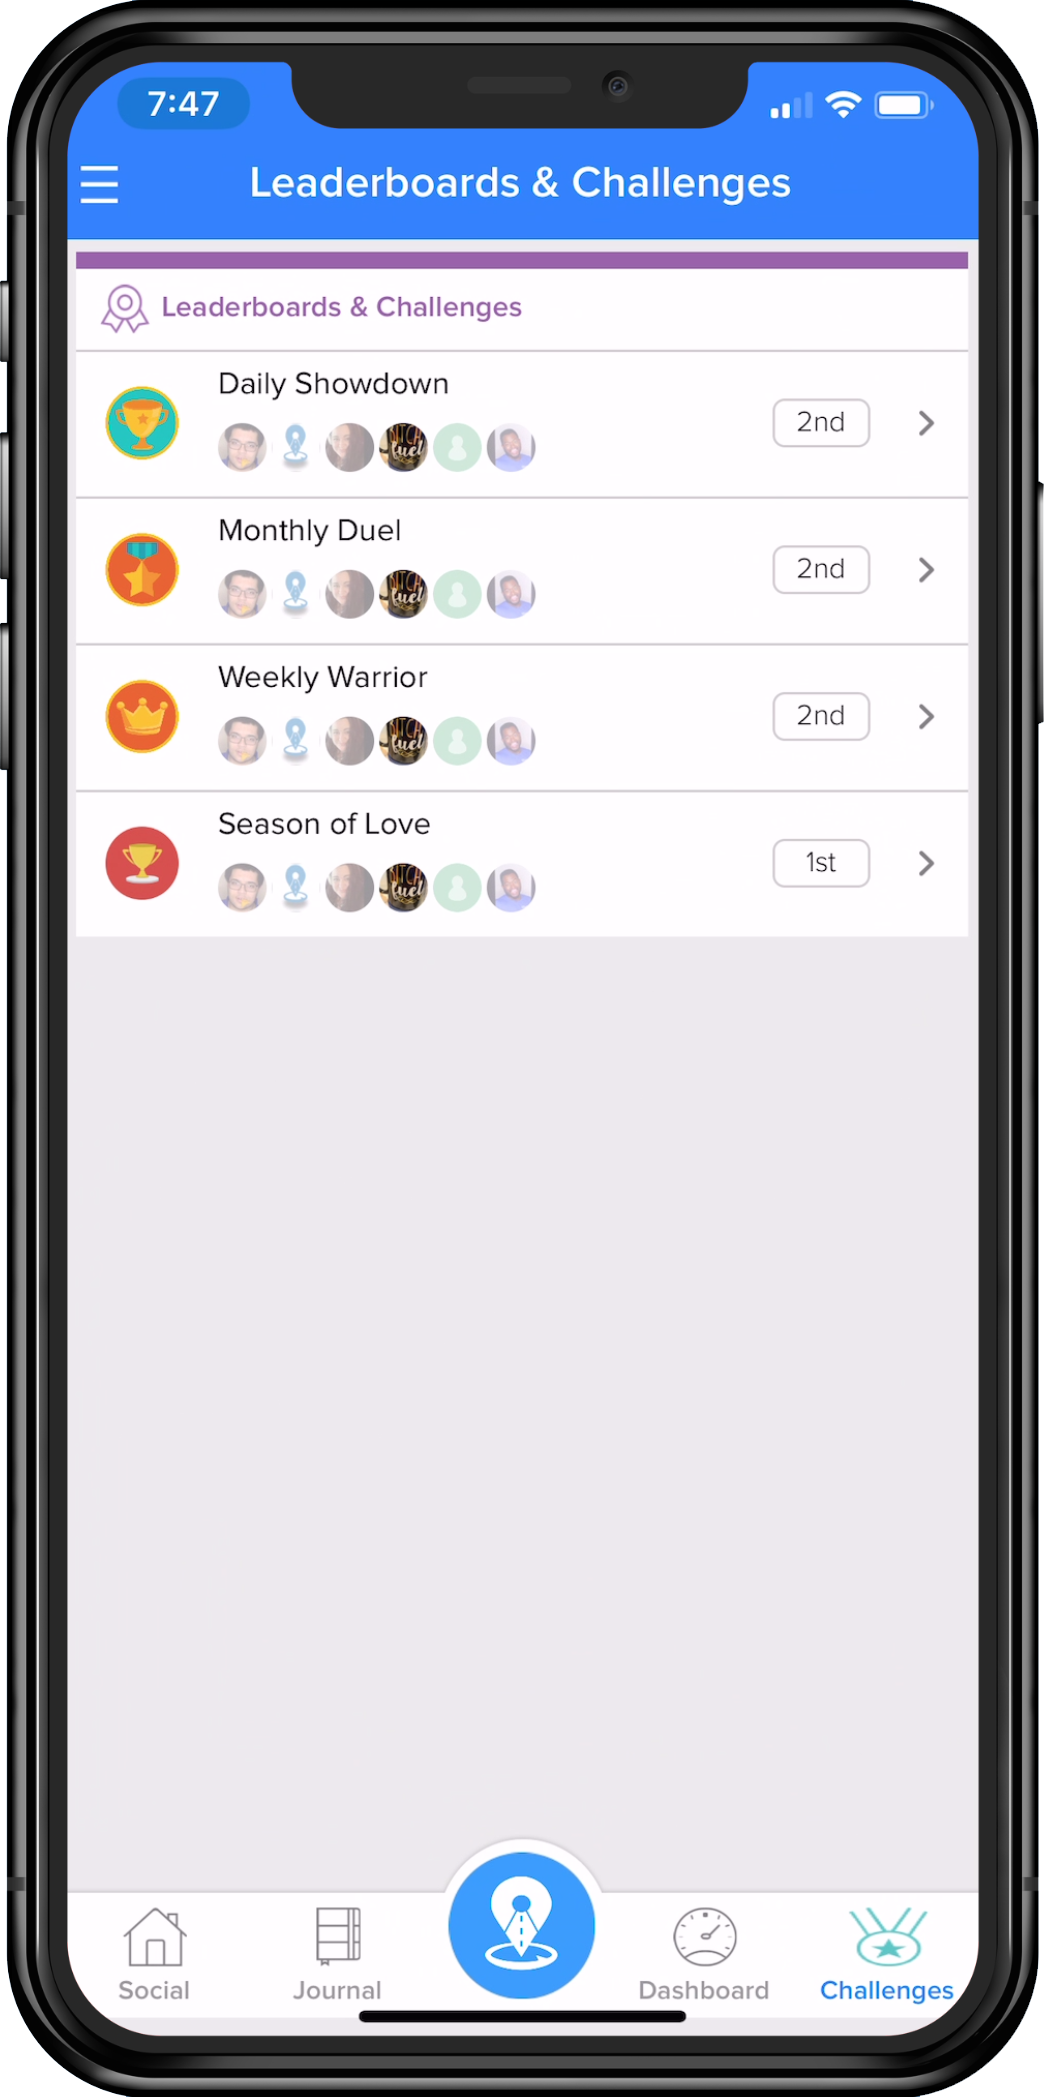
Each Leaderboard or Challenge can be clicked on for further detail of stats.
Sales Menu
The Sales menu will show a list of invoices a distributor has reported to Lilypad. When 'Sales' is clicked, the first screen populates a list of Distributors to choose from. Click the Distributor of choice to populate a list of invoices received. The order of the list will be most recent at the top. In order to see historical invoices, scroll to the bottom of the screen and click the button that says 'Load More'.
Users can search through this list of invoices for each distributor by clicking into the search bar at the top of the screen and looking for either a specific account (by name) or a specific brand/SKU.
***When performing the search, please note - the search will only return results for what is loaded onto the screen at the moment. For example; the user scrolls up and down and only sees invoices dated for this week. Any search entered into the search bar, will only net a result for this week. To be able to search for last week's data, the rep would need to click the 'Load More' until invoices from last week populate.
Manager / ... More Menu
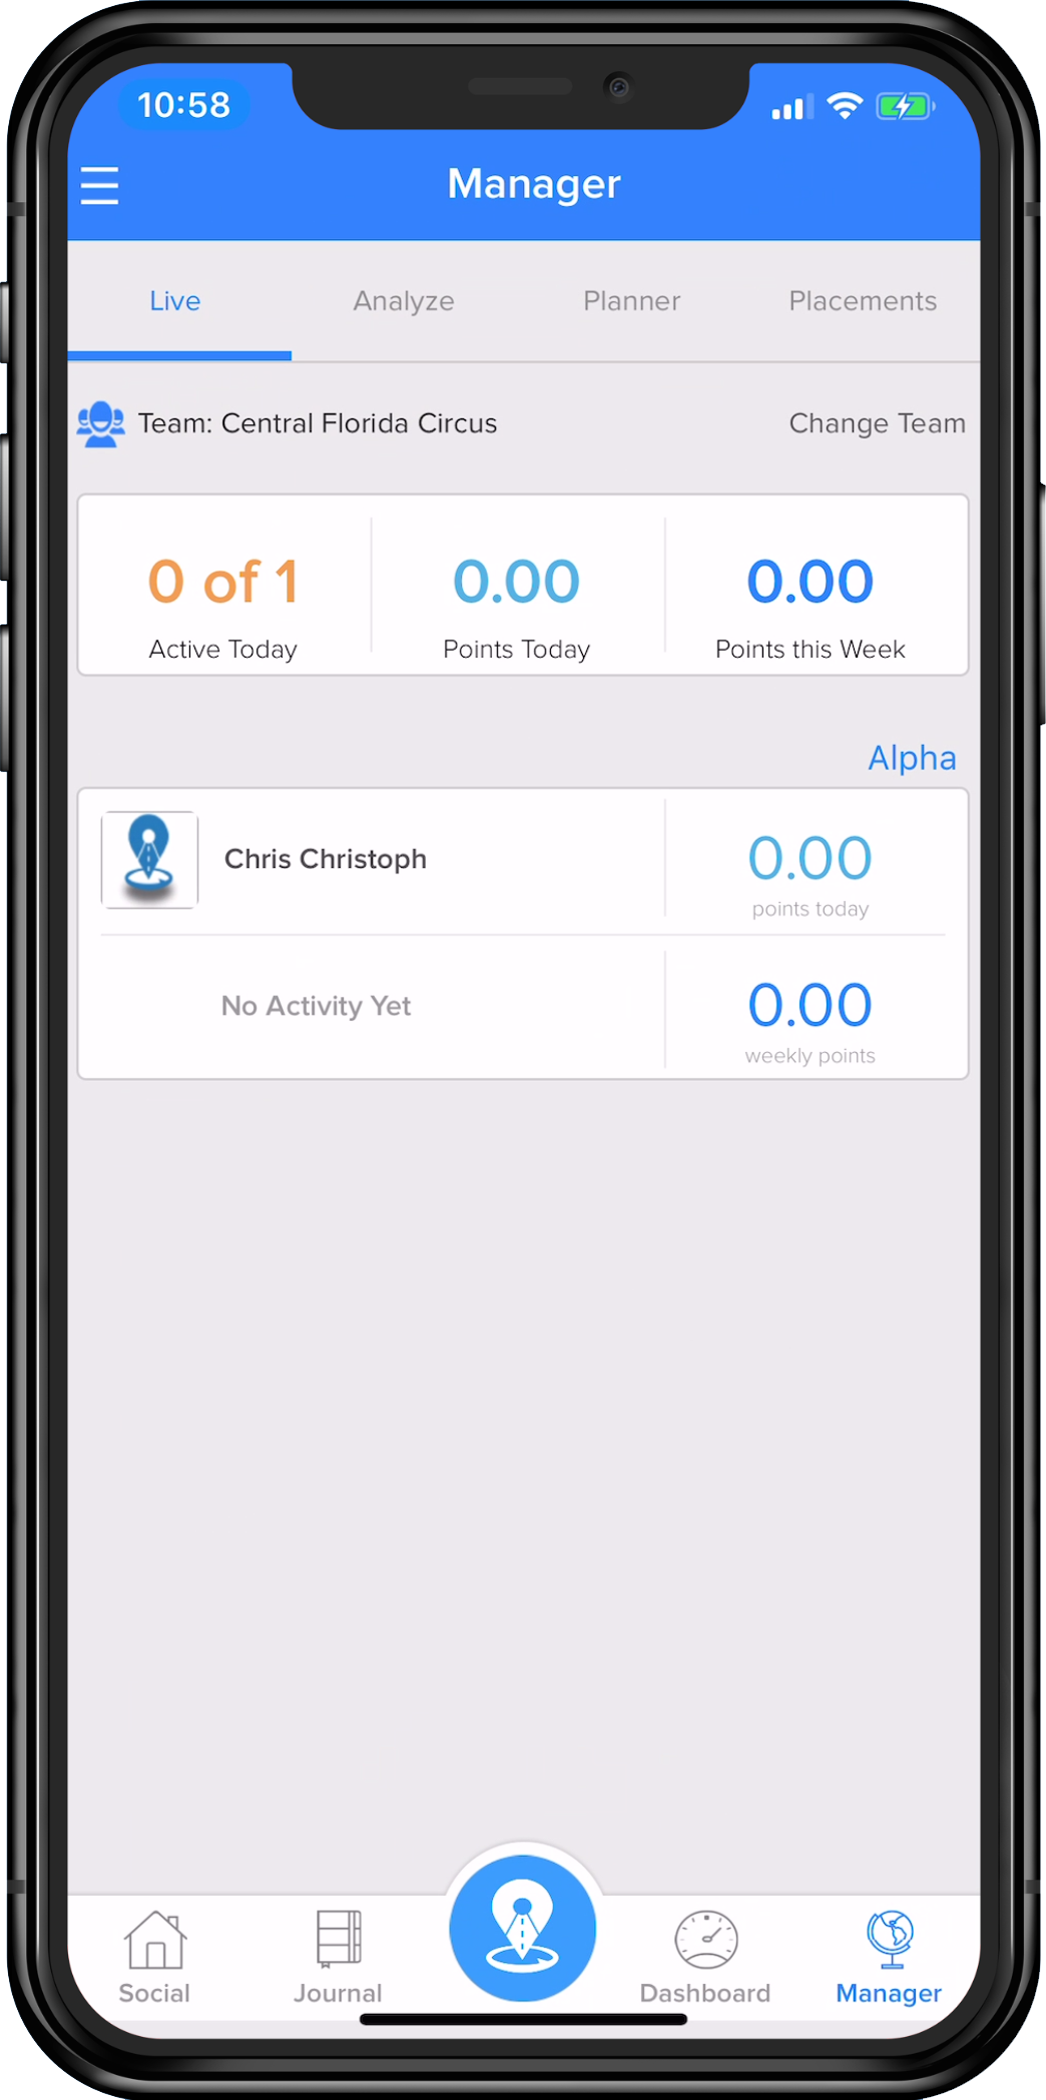
This view is only available for Admin / Managers. If sales data is available and being reported, the Manager button at bottom right will say '... More' instead. If it says '... More', The Admin / Manager can choose to see Sales or the screen noted above. In the Manager screen, anyone with Admin access can view stats for teams that they are assigned to. The quicklinks included are Live, Analyze, Planner and Placements.
The team can also be changed if an Admin user has access to more than one team, as seen under the quicklinks tabs.
Quicklinks Tabs Under Manager
Live
As seen in the image above, this tab will show each team member for the specified team and what activities they have logged for the current day. It will also indicate cumulative daily and weekly points.
Additionally, each user from that list can be clicked on to generate a view of the team member's Timeline, Goals Trackers and Planner - making visibility of each rep's actions and planned action easy and in one place.
Timeline: History of actions logged dating back for three months and scrollable.
Goals: Simple view of selected rep's goal trackers. Each tracker can be clicked on for further details such as; Accounts that contributed to the goal, an overview of the goal parameters, and the goal history of that particular rep.
Planner: Allows an easy view of the chosen rep's planned month. Choose a day to view and the actions planned for that day will populate at the bottom portion of the page.
Analyze
This graph displays data in relation to rep versus points with two choices for viewing - based on counts or duration.
Planner
The Planner quicklink produces a snapshot of each rep's numeric amount of planned activities for Visits, Events and Follow Ups during the chosen week. The individual rep can be clicked on to open their specific planner.
A manager can also change the viewable week by clicking 'PREV' on the top left of the gray bar, situated directly under the quicklinks.
Placements
This is a great snapshot view of the selected team's placements that have been made for the selected month. It offers a view of the total team's accumulative information as well as a per rep break down.
Each rep's logged data can be seen as Fulfilled CEs and Remaining CE amounts, as well as the total amount of Placements fulfilled and remaining.