
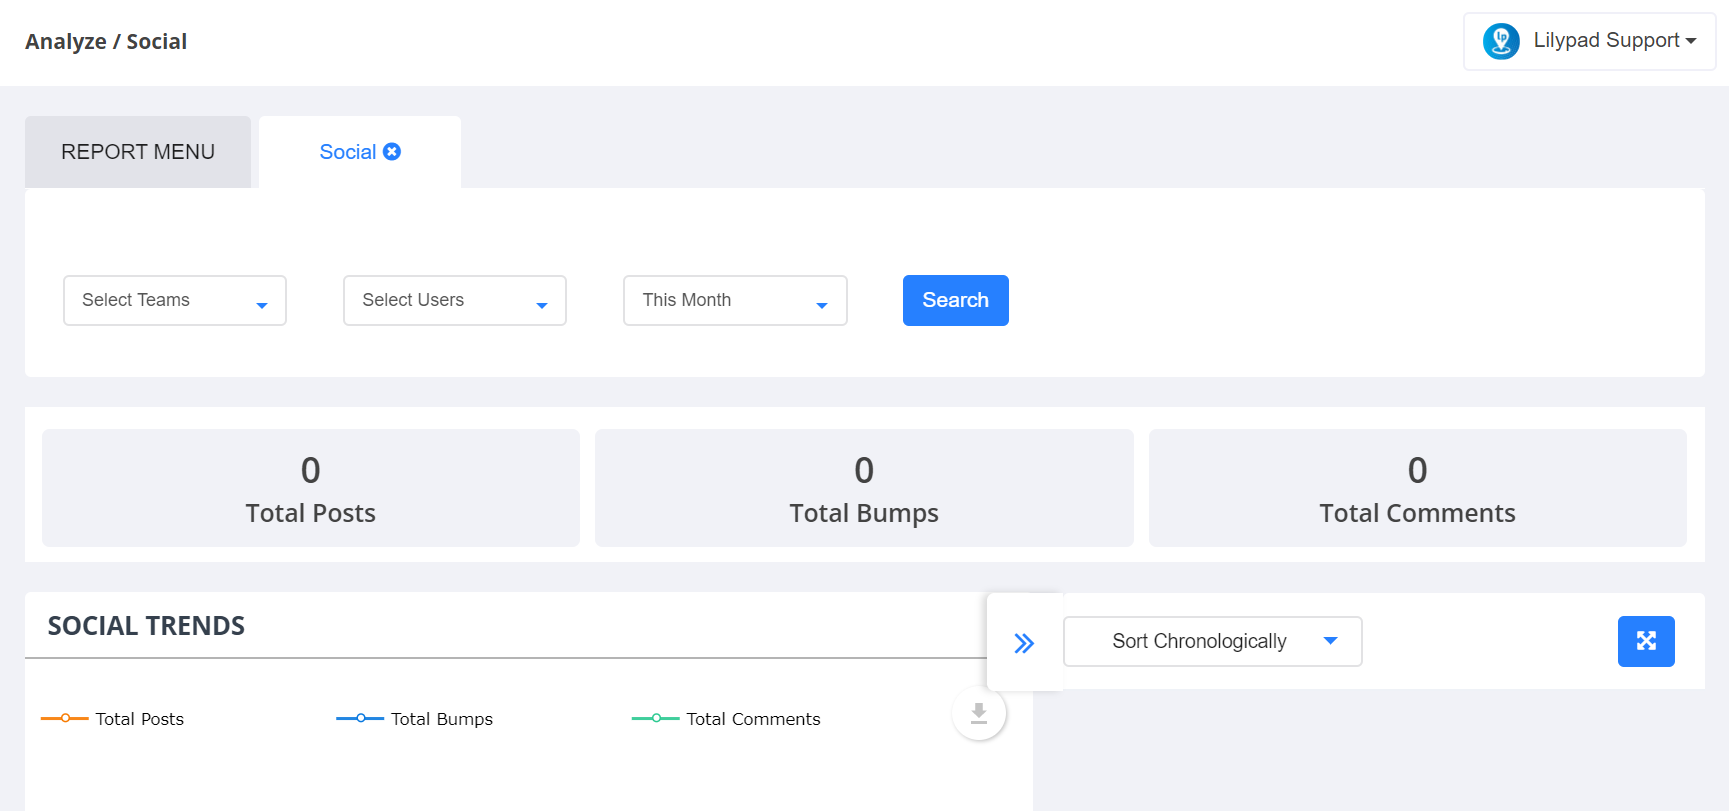
This report shows the trends of each team's activity on the social wall.
- Choose the team(s) to include in this report.
- Choose the rep(s) to include.
- Choose the time frame for this report.
- Click “Search”.
- This report generates the total number of posts, bumps, and comments made on the social wall.
- The right side of the report window, shows all posts made to the social wall in the selected time frame.
- The left side of the report window, shows the following tables:
- Social Trends: this shows a line graph where the x-axis shows the number of posts/bumps/comments made and the y-axis shows the time frames in which those posts/bumps/comments were made.
- Social Activity by User: this shows a bar graph that outlines the likes/posts/comments made by each rep, ordered from highest or lowest as default. This can be changed to show Lowest to Highest instead.
- Social Posttypes: this table shows a pie chart that outlines which types of posts (text, photo, video, link, or poll) have been posted to the social wall for the selected time frame.
- Social Stats: this table shows a breakdown of social wall stats by rep It shows the rep's name, the team that rep belongs to, and the total number of posts, comments, and likes each rep has added to the social wall in that time frame.