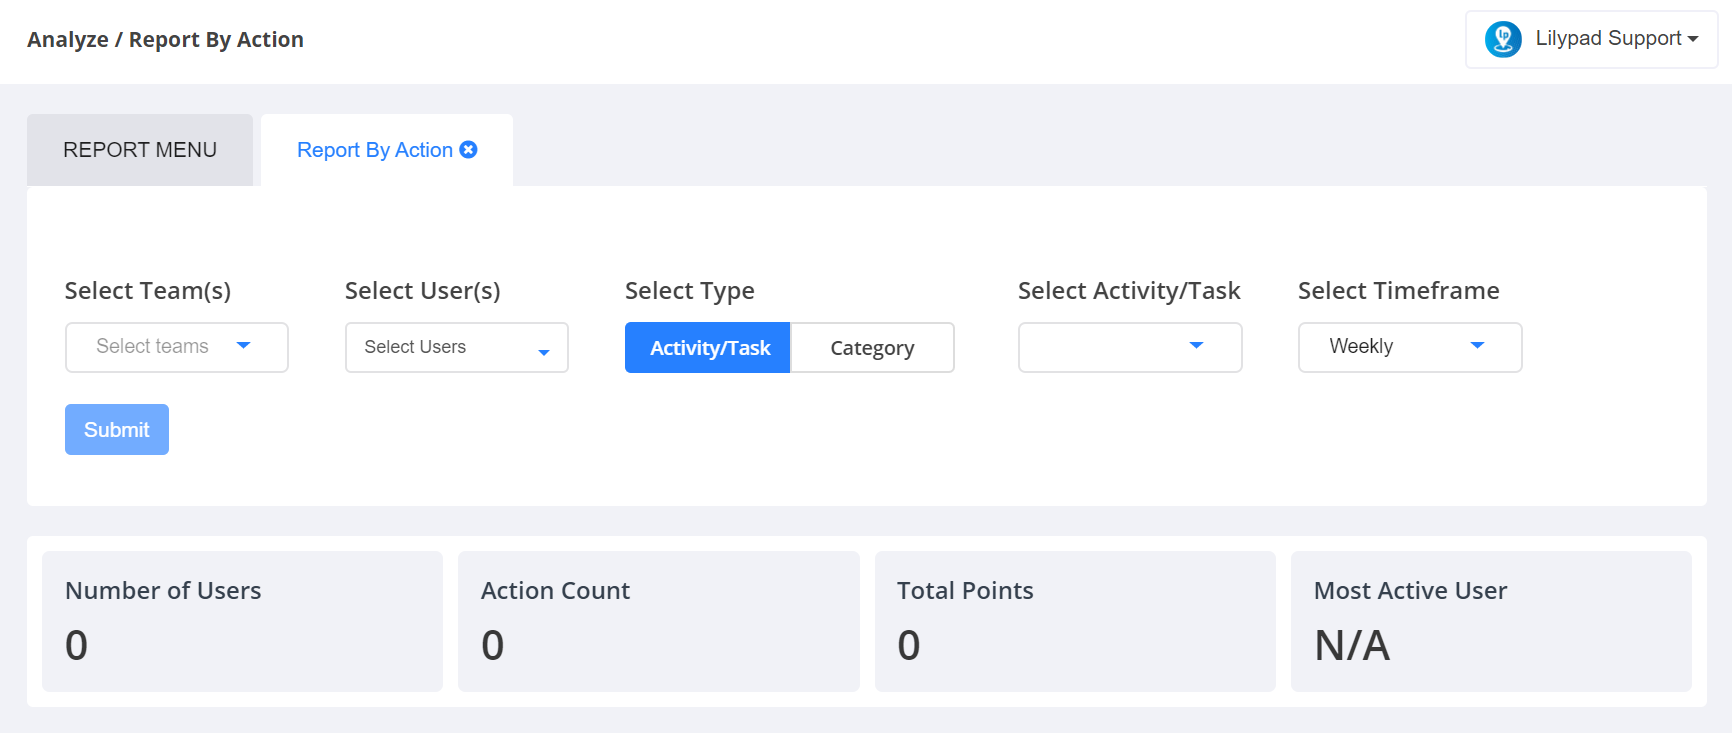
Choose the type of report to generate – either an Activity or Task based report or a report on an overall Category.
Choose the specific Activity, Task or Category sub-item in the next drop down.
Choose the time frame for the report.
Click “Submit”.
After the report runs, the following information is generated in the boxes below:
Header - Name of Activity, Task or Category chosen as well as time frame.
Number of Users – Total number of reps that have entered an applicable log in the selected time frame.
Action Count – Total number of that action that was logged by all reps in the selected time frame.
Total Points – Total number of points earned from logged actions by all reps in the selected time frame.
Most Active User – Name of the rep who logged the highest number of applicable entries during the selected time frame.
Selected Report Metric – By Date: A bar graph where the x-axis shows the number of items logged and the y-axis shows the date on which the items were logged.
Selected Report Metric – By User: A bar graph where the x-axis shows the number of logged items and the y-axis shows the rep(s) who have logged the selected items.
Selected Report Metric – AM vs. PM: A pie chart that will show the percentage of logs made in the AM hours versus the PM hours.
If the report was ran on a specific Activity/Task, there will be an option that reads “Click here to create custom graph”. This allows a custom graph to be created based on individual fields within the selected Activity/Task. Select which field to use to create the graph and what format the graph should be presented in (bar graph, line graph, or pie chart) and then click the green OK button.
Image Gallery – This shows all photos logged in correspondence with the selected Activity, Task, or Category. This selection shows which rep uploaded the image, the date on which the image was uploaded, and what field the image was attached to. The images are downloadable directly from this page by clicking the blue “Download” button below the image. To see additional images, click the forward or back arrows to toggle through the image gallery.
Activity Log table – This shows the detail, including all notes and information added, for each individual log made under the selected metric. This report table can be exported by clicking the blue 'Export' button in the top right corner, which will trigger an excel file download.